Girl's Frontline Bingo Math

Just cute girls with guns doing cute things. No crippling depression, PTSD, and implications of sexual abuse to see here. Source: GFL presskit
About 3 months ago, I wanted to get into gacha games to understand why they are so popular. Gacha games are named after Japanese vending machines called “Gachapons” that disperse random capsule toys. Their defining characteristic is a lottery to obtain additional characters, costumes, etc. It’s a mechanic that you’ll also see in other types of games nowadays as well, in the form of loot boxes or booster packs, but the lottery is a big part of the experience in a gacha game. Gacha games have somewhat of a reputation that they’re money sinks, because rolls can be obtained via real money and getting what you really want typically requires a lot more rolls than you can get for free.
Watching other people go into the pits of gacha hell might be funner than actually doing it yourself. At the very least, it’s healthier for your wallet. 1
I had decided on a game called “Girls Frontline”, and I’ve been playing it ever since. In this game, you are collecting android girls called “T-dolls”, each representing a particular gun model, and sending them off into battle in a post-apocalyptic world. There’s a character for every anime trope you can think of, so everyone can find something they like. For example, there’s a mother-like model that represents the M1903 Springfield, a sleepyhead model that represents the german G11, a tsundere sniper rifle, and a whole entire team representing just the M4/M16 weapon platform. 2.
If you’re into collectathons, cute girls, guns and/or post-apocalyptic war torn worlds, I recommend at least giving the game a try. It’s “free” after all (just be responsible with your money spending). But I’m not writing here to tell you to play this game. I’m writing about a question that popped into my head while playing the game, and the (over-)application of mathematics I went through to answer said question.
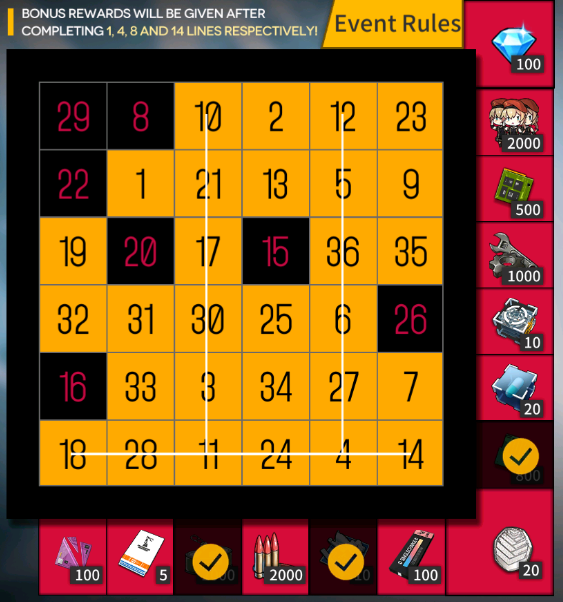
As of this writing, Girl’s Frontline is running an “bingo event”. There is a 6x6 grid of numbers, and you can earn random pull tickets by doing missions that refresh daily. The numbers you pull are marked on your grid, and you earn prizes each time you mark all the numbers on a line. You also earn bonuses if you reach thresholds of the number of completed lines. The max bonus threshold is 14 lines, which can only be obtained if you mark the entire grid (6 horizontal lines, 6 vertical lines, and 2 diagonal lines).

My current bingo grid. Most of it is filled out and only 7 numbers remain. I’ve also filled out 3 lines.
One quirk is that the random numbers can repeat. So you start off marking off the grid really quickly. But later when you have half the grid filled, you’ll find yourself getting repeat numbers over half the time. This may seem like the classic tactic of hooking people in early just to upcharge them later when they’re committed, like how a drug dealer deals with addicts. But one can’t even buy more tickets with cash, so I can’t even throw my money at it even if I wanted to! So naturally I wondered what my chances were to fill in the whole grid by the time the event closes. If it was impossible to luck into filling the entire grid, then perhaps I could do better things with my pulls like exchanging the pulls for other prizes directly.
Using geometric distributions to get an average number of pulls
Let’s ignore the bingo lines since I’m just interested in the time it takes to fill out the whole grid. The question I’m then asking is:
Given a set of 36 numbers, how many random pulls (with replacement) does it take draw each number at least once?
Let’s first look at smaller examples.
What if there’s only 1 number to mark? The answer is clearly 1 pull.
So what if there’s 2 numbers to mark? The number of pulls necessary is now a random number, which can vary from 2 at the luckiest, to arbitrarily large if you’re really unlucky picking the same number repeatedly until you finally pick up the second number. We can break the number of pulls down into two parts, the number of pulls it takes to get one number (it doesn’t matter which one), and then the number of pulls it takes to get the other one. The first part is the amount of pulls it takes to get one of 2 out of 2 numbers, and the second part is the amount of pulls it takes to get one of 1 out of 2 numbers.
I introduced shorthand notation to denote the time it takes to pull any one of out of numbers, and as the total time it takes to pull $k$ unique numbers from numbers. is a random number itself, so what is its distribution? Clearly is 1 with probability 1 (similarly for any for any ). Once though, the time needed can vary randomly.
Let’s consider , the time it takes to get any of k target numbers out of t total numbers. With probability , you will get a target number and the process ends. With probability , you miss and you need to keep going. So for to be exactly (that is, you needed exactly pulls to get any one of target numbers of total numbers), you need to have missed on pulls and then finally hit a target on the last pull. The probability of this happening is .
So we have:
If you’re familiar with probability distributions, this is a geometric distribution where the probability of a success is . The number of pulls it takes to fill out all 2 numbers turns out to be the sum of two random variables with geometric distributions.
We can extend this reasoning to the original problem of filling out a grid of 36 numbers. First, we have to hit any of 36 of 36 numbers. Then we have to hit any of the remaining 35 of 36 numbers which takes time according to a geometric distribution with success rate . We repeat this process until we’re left with trying to hit the last 1 of 36 numbers with a success rate of just numbers.
We now have this breakdown of time it takes to fill out all 36 numbers as a sum of 36 random variables with geometric distributions.
From here, it’s pretty easy to get the average number of pulls necessary to fill the grid. The average of a sum of random variables is the sum of the averages of those variables, by linearity of expectation.
The expected value of a geometric distribution with success rate is . So . We then have:

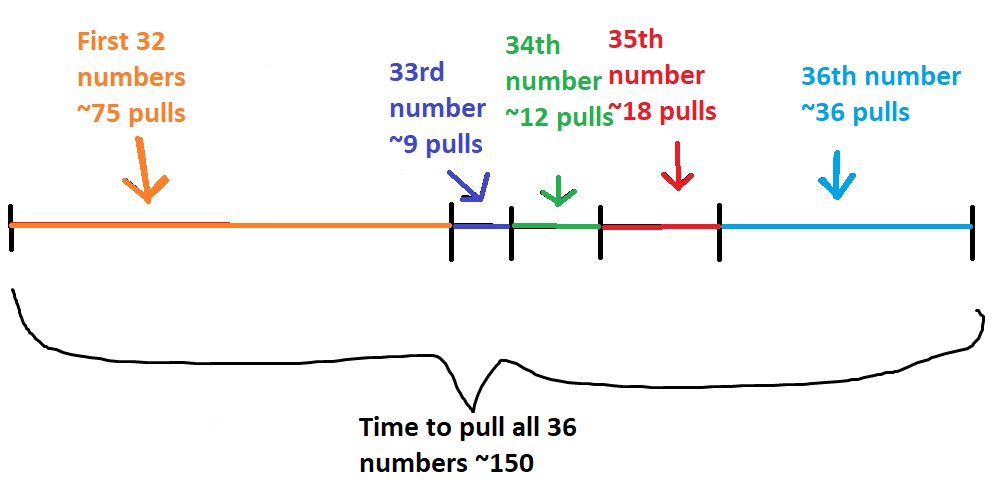
A visual representation of the time it takes to pull all 36 numbers. Drawn to scale of perceived time wasted due to just drawing repeat numbers again and again.
So it takes about 150 pulls on average to fill the entire 6x6 grid. The event runs for 21 days, and each day you can earn 9 pulls, for a total of 189 pulls. So it seems that we have more than enough pulls available to be more likely than not to fill the entire grid. But what is the actual probability of filling the entire grid assuming by the end of the event?
Figuring the probability of filling the grid by some number of pulls
The question of the probability of filling the entire grid within some number of pulls is . If we first tackle the question of the probability of getting it in exactly pulls, (), then we can add the probabilities for exact pull times for up for all values .
The probability distribution of sums of non-identically distributed random variables is rather annoying. Generally you have to go through all possible way to split up the target value and add up a joint probability for each split.
Something horrendous like:
I don’t know if there’s an easier way to express this. So instead, I made a program to calculate this value directly. Conceptually, I broke down the formula into a recursion that starts with the base case of drawing just the first number, and then builds up the calculation one step at a time using the value from accumulating up all the previous steps.
For example, let’s say that we want to calculate the probability of the number of pulls to draw 36 numbers being . Then for every way to split up into two parts and , we combine the probability of getting the first 35 numbers in exactly pulls with the probability to get the 36th number in pulls. To get the probability getting the first 35 numbers in exactly pulls, we would do a similar calculation, splitting up into all ways to get the first 34 numbers in some times and then the 35th number at the pull. And so on, so forth until we get to only 1 number which we already know to be a binomial distribution.
Here’s the recursion in formulas:
Here’s the code if you want to see it. The probability of filling in the grid by 189 pulls turns out to be around 83.69%. This feels pretty good, but there’s still about a 1/6 chance that we might not fill the grid.
Taking the pity system into account
Many gacha games have pity systems that alleviate the “feels bad” part of random draws, by giving you points per pull that you can trade in for what you really want. In this bingo event, every single time you draw a repeat number, you get a pity point. With 10 pity points, you can pity pull (for free!) whatever number you want. 3
From the previous section, we saw that we would need 150 pulls on average to fill the grid naturally. Since there’s only 36 numbers, that’s 114 extra pulls that would convert to pity points for about 11 targeted pity pulls along the way. It seems obvious that this should reduces the number of pulls we need to fill the grid and increase the probability that we can fill the grid by the end of the event. But by how much does the pity system help?
Let’s assume we save our pity points until we collected enough pity points to fill out the remaining numbers, as opposed to spending the pity points on random numbers along the way.
Suppose we’ve pulled enough unique numbers and enough pity points to finish the grid at exactly pulls. There are 2 cases:
- The last pull was a new number, and then we had enough pity points to pay for the remaining numbers.
- The last pull was not a new number, but the pity point obtained was the last one needed to have enough pity points to obtain the rest of the numbers.
Let’s first consider the first case where the last pull was a new number, and it was the kth unique number. There were n pulls with only k unique numbers, implying repeat numbers were drawn, which means that we obtained pity points. To finish the grid, we need to have obtained at least pity points to get pity pulls to fill out the rest of the grid. Clearly, we can’t use more pity points than we obtain. Also, the surplus of pity points left over can’t be enough to obtain another pity pull because it implies we could have completed the grid earlier. This gives us this constraint on the value of the number of naturally drawn unique numbers .
Massaging this to isolate k gives:
Note that k is inside an interval of size , which is just barely over 1, and k is an integer. This means that there are only at most 2 valid values for k, but usually just 1 valid value.
We already calculated the probability of getting the k value on pull on the previous section. The probability of finishing the grid on pull when the last draw was a new number is then:
Now let’s consider the 2nd case, where the last number is not a unique number.
Let’s say that there were k naturally drawn unique numbers over n pulls, but the kth number was not drawn exactly at the nth pull. Similarly to the first case, let’s try to reason about what the value of k must be. Again, we need to use (36 - k) * 10 pity points, and we’ve obtained (n - k) pity points. But now, these two values must be matched with equality. If the number of pity points obtained is more than the number of pity points used, this implies that we had already enough pity points to finish the grid without the extra pity point that the last pull earned.
This gives us this condition on the number of unique naturally drawn numbers k:
Since k is an integer, this implies that there’s a valid solution for only if n is divisible by 9. But if n is indeed divisible by 9, the count of uniquely drawn numbers is determined. But we don’t know when the kth unique number was drawn, except that it wasn’t on the nth pull. Let’s say that the kth unique number was drawn in the mth pull, with m < n. Since only k unique numbers were drawn over n pulls, this means that the remaining (n - m) pulls were limited to the k already drawn numbers. This happens with probability . We can then add up all the cases over all valid values of the exact pull time .
Adding up these 2 cases gives us the new probability distribution of the number of pulls needed to fill the grid with pity. Here’s the code to do those calculations.
Using these formulas, the average number of pulls needed to fill the grid goes down to about 75 pulls, and it’s a near certainty that we’ll be able to complete the grid within the max obtainable 189 pulls given in the event time. I guess I don’t have to worry about not filling out the grid then!
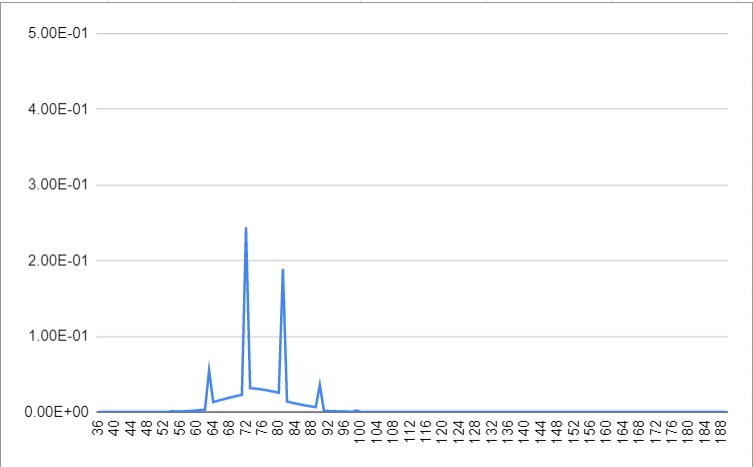
Just for fun, here’s a chart showing the probability distribution of the number of pulls needed.

There are very noticeable spikes at multiples of 9, particularly at values 63, 72, 81, and 90. The effect of the case where the last draw was not a unique number must be quite large, and we know from before that this can only happen at multiples of 9. In fact, over half the time, you will be able to fill the entire grid exactly on a multiple of 9. It’s probably no accident then that the developers set the daily rate of pulls to 9. This might have been a deliberate choice to get their players to feel good at the last pull of the day. I just thought this was an interesting phenomenon that I saw from real sample data that corresponds with predictions from the probability model.
If you like this kind of fun use of math towards inane topics, and have any questions, comments, suggestions for other things to ponder about, or you just wanna say hi, you can email me at me@lalaheadpats.com.
Footnotes
-
If this is the first time you’re seeing an anime avatar streamer and you found yourself wanting more, I’m sorry to have pulled you down the hole that is vtubers and you’ll have to deal with all the youtube recommendations. I got pulled in this hole around the same time I started playing Girls Frontline. The hole is very, very deep and I haven’t found the bottom yet. ↩
-
If guns aren’t your thing, there’s also media for anthropomorphized tanks and warships. If you’re into anything at all, some asian country has already made it into a moe character. ↩
-
Technically, it’s actually a rate of 10 pity points per repeat number and 100 points to get a pity pull, but I just wanted to simplify the numbers. ↩